Generating Excel Files with Node.js and ExcelJS
In this guide, we'll explore how to generate Excel workbooks using Node.js with the help of the ExcelJS library. This module offers a straightforward interface for creating Excel documents and supports advanced features like text formatting, borders, and formulas.
Let's start by defining a simple interface to hold our sales data.
interface WeeklySalesNumbers {
  product: string;
  week1: number;
  week2: number;
  week3: number;
}

const numbers: WeeklySalesNumbers[] = [
  { product: 'Product A', week1: 5, week2: 10, week3: 27 },
  { product: 'Product B', week1: 5, week2: 5, week3: 11 },
  { product: 'Product C', week1: 1, week2: 2, week3: 3 },
  { product: 'Product D', week1: 6, week2: 1, week3: 2 },
];
We'll create a function to generate the workbook. First, we initialize the workbook and add a worksheet named "Sales Data."
async function generateSalesReport(weeklySalesNumbers: WeeklySalesNumbers[]) {
  const workbook = new Excel.Workbook();
  const worksheet = workbook.addWorksheet('Sales Data');
Next, we define the columns for our worksheet. ExcelJS allows us to use key-value pairs to assign values to the worksheet.
  worksheet.columns = [
    { header: 'Product ID', key: 'product', width: 20 },
    { header: 'Week 1', key: 'week1', width: 10 },
    { header: 'Week 2', key: 'week2', width: 10 },
    { header: 'Week 3', key: 'week3', width: 10 },
    { header: 'Product Totals', key: 'productTotals', width: 12 },
  ];
We then add our sales data to the worksheet. For each row, we use a formula function to calculate the total sales for each product.
  weeklySalesNumbers.forEach((data, index) => {
    worksheet.addRow({
      ...data,
      productTotals: generateProductTotalsCell(worksheet, index + 1),
    });
  });
We also add a row to show the total sales for all products each week using another formula function.
  const totalsRow = worksheet.addRow([
    'Weekly Totals',
    generateWeeklyTotalsCell(worksheet, 'B', weeklySalesNumbers.length),
    generateWeeklyTotalsCell(worksheet, 'C', weeklySalesNumbers.length),
    generateWeeklyTotalsCell(worksheet, 'D', weeklySalesNumbers.length),
    generateWeeklyTotalsCell(worksheet, 'E', weeklySalesNumbers.length),
  ]);
To enhance readability, we format the first row and the totals row by making them bold. We also add borders to the totals row to highlight it as a summary.
  worksheet.getRow(1).eachCell((cell) => {
    cell.font = { bold: true };
  });

  totalsRow.eachCell((cell) => {
    cell.font = { bold: true };
    cell.border = {
      top: { style: 'thin' }, bottom: { style: 'double' },
    };
  });
We freeze the panes to keep the product and column headers visible while scrolling through the spreadsheet.
  worksheet.views = [
    { state: 'frozen', xSplit: 1, ySplit: 1, activeCell: 'B2' },
  ];
Finally, we write the workbook to a file.
  await workbook.xlsx.writeFile('sales-report.xlsx');
}
The function to generate product total cells uses the
SUM function to calculate totals for each product.
function generateProductTotalsCell(worksheet: Excel.Worksheet, rowIndex: number) {
  const firstColumn = 'B';
  const lastColumn = 'D';

  const firstCellReference = `${firstColumn}${rowIndex + HeaderRowsCount}`;
  const lastCellReference = `${lastColumn}${rowIndex + HeaderRowsCount}`;

  const sumRange = `${firstCellReference}:${lastCellReference}`;

  return {
    formula: `SUM(${sumRange})`,
  };
}
Similarly, we create a function to calculate weekly totals, which sums up the sales data for each week.
function generateWeeklyTotalsCell(worksheet: Excel.Worksheet, columnLetter: string, totalDataRows: number) {
  const firstDataRow = HeaderRowsCount + 1;
  const lastDataRow = firstDataRow + totalDataRows - 1;

  const firstCellReference = `${columnLetter}${firstDataRow}`;
  const lastCellReference = `${columnLetter}${lastDataRow}`;
  const sumRange = `${firstCellReference}:${lastCellReference}`;

  return {
    formula: `SUM(${sumRange})`,
  };
}
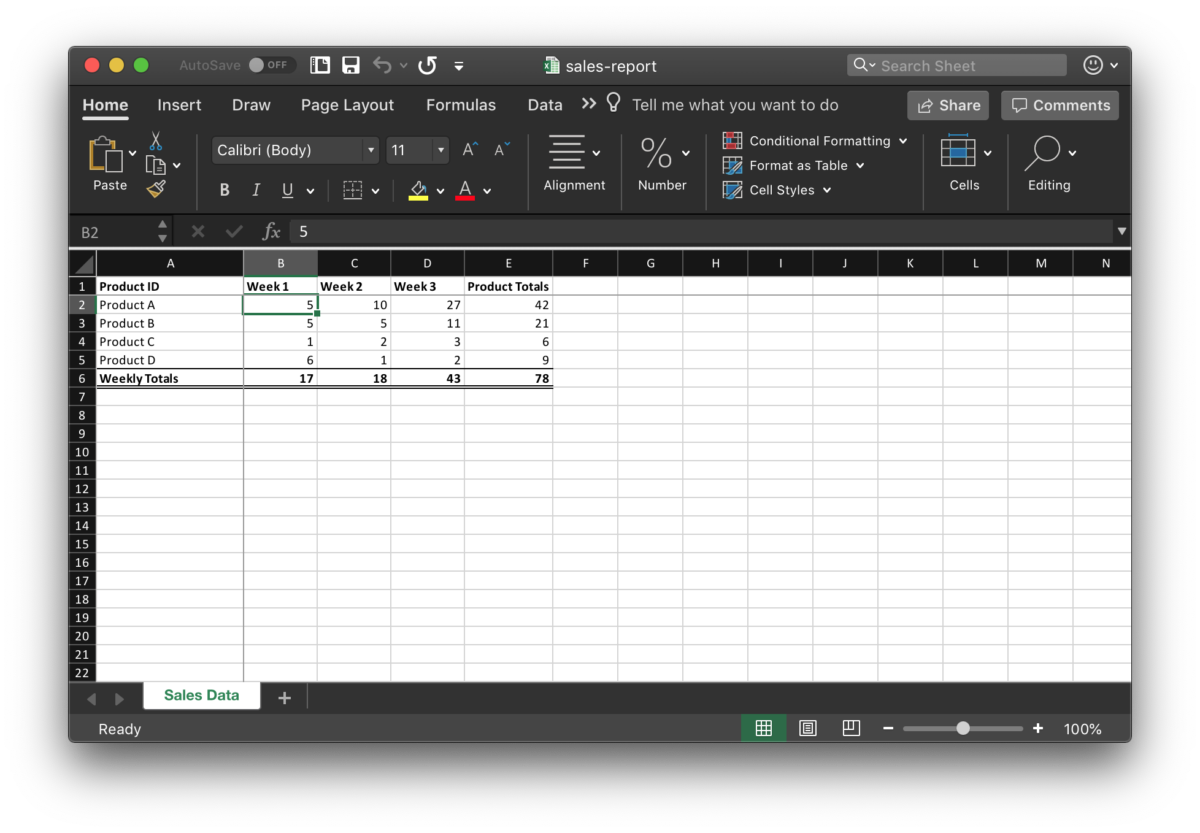
Opening the file in Excel will display a well-organized spreadsheet.

While this example is straightforward, ExcelJS is a powerful tool for generating complex reports efficiently.